
Tutorial 1
Navigating the platform
A guided tour of the main areas of thinkorswim: where charts, watchlists and settings live.
Coming soon
Plain-English tutorials on building charts and finding your way around the thinkorswim platform.
I like building charts, and I like helping people find their way around Schwab’s thinkorswim platform. This section collects short, step-by-step tutorials for people who are new to it, or who want to tidy up how they work with charts.
Everything here is educational. It explains how the tools work. It does not tell you what to do with the market.
Coming soon. Thumbnails are placeholders drawn from synthetic data.
A guided tour of the main areas of thinkorswim: where charts, watchlists and settings live.
Coming soon
Pick a symbol, choose a time frame and chart type, and read what is on the screen.
Coming soon
Add moving averages and other studies to a chart and adjust how they look.
Coming soon
Arrange several charts in a grid and save the layout so it is ready next time.
Coming soon
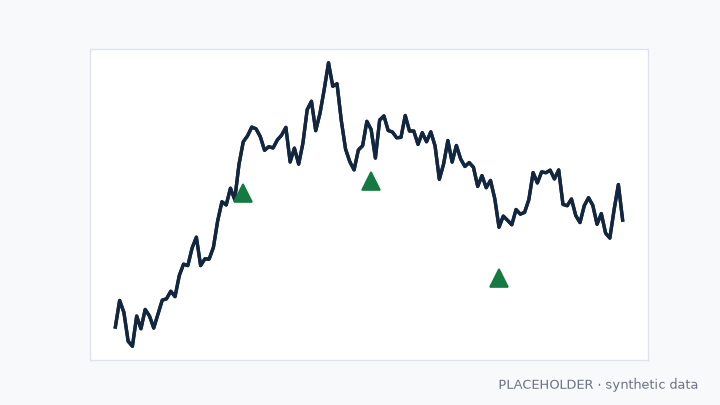
See how the Scorecard’s six signals can be displayed alongside a price chart.
Coming soon
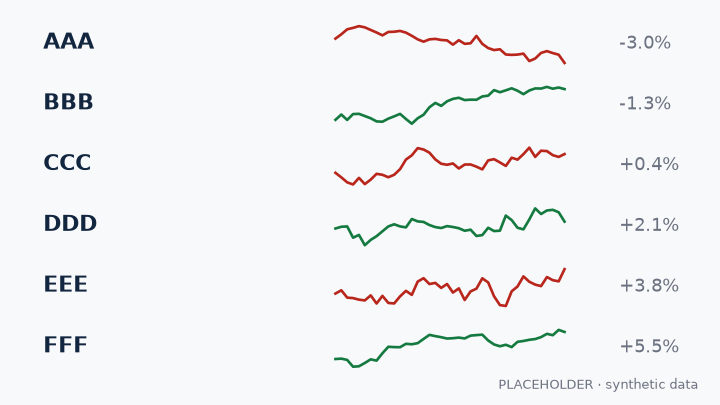
Create a watchlist, add columns and keep a set of symbols in one view.
Coming soon
Each tutorial is planned as a short screen-recorded video. A link will appear here once the channel has videos.
Educational content only, not investment advice. Regime Stack is not affiliated with or endorsed by Charles Schwab & Co. thinkorswim is a registered trademark of its owner.